Building Applications in Cinema:Theater
One of the most powerful capabilities of pycinema is support for building new filter graphs, specific to a task. It’s easy to connect filters together, adjust views, and create visual layouts of information that help you look at complex data.
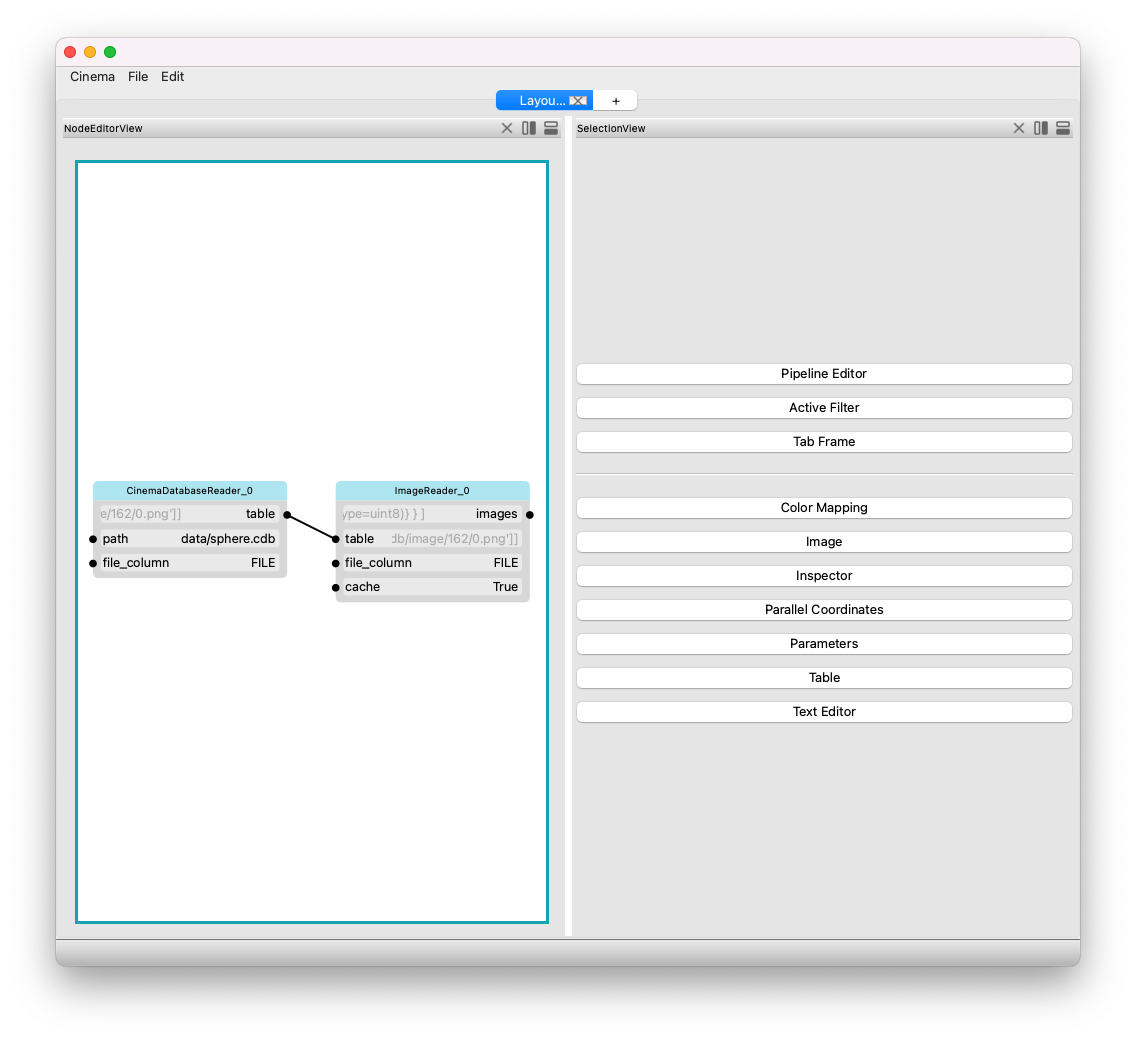
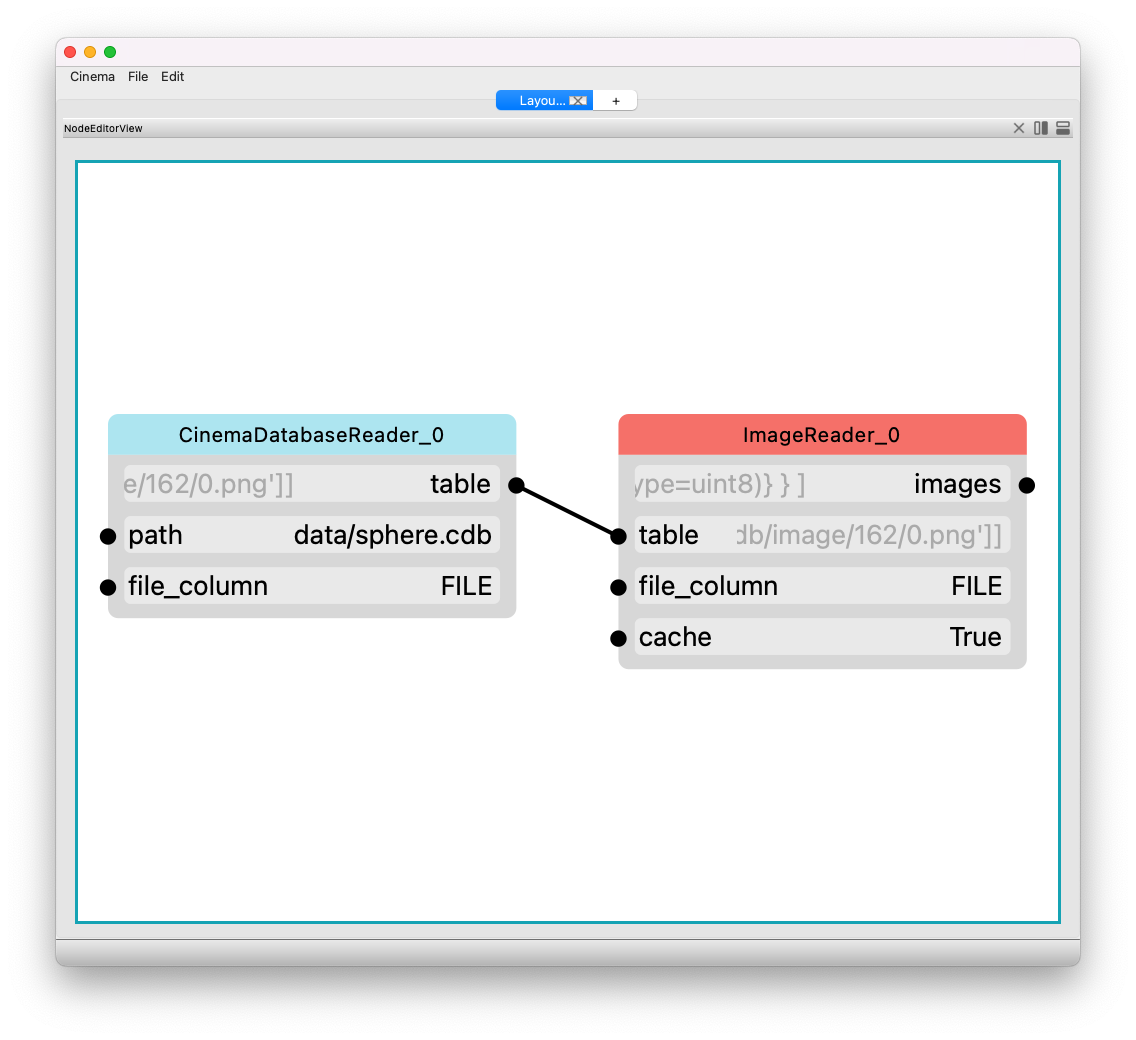
Components of a single filter UI
Each filter will have places that can accept input (like a text box), and dots showing places that can be connected (either inputs or outputs. In this example, we see the inputs and outputs of a CinemaDatabaseReader filter. The labels are explained below.

Filter name. This is automatically generated.
Non-editable attribute value. This data, displayed in greyed out text, shows the value of the input or output, but is not editable by the user.
An input parameter, with connection dot. This parameter (named file_column, in this example), can be connected to some value (output).
An output parameter, with connection dot. This parameter (named table, in this example), can be connected to in input.
Editable parameter value. This data can be edited by the user.
Building a simple filter graph —
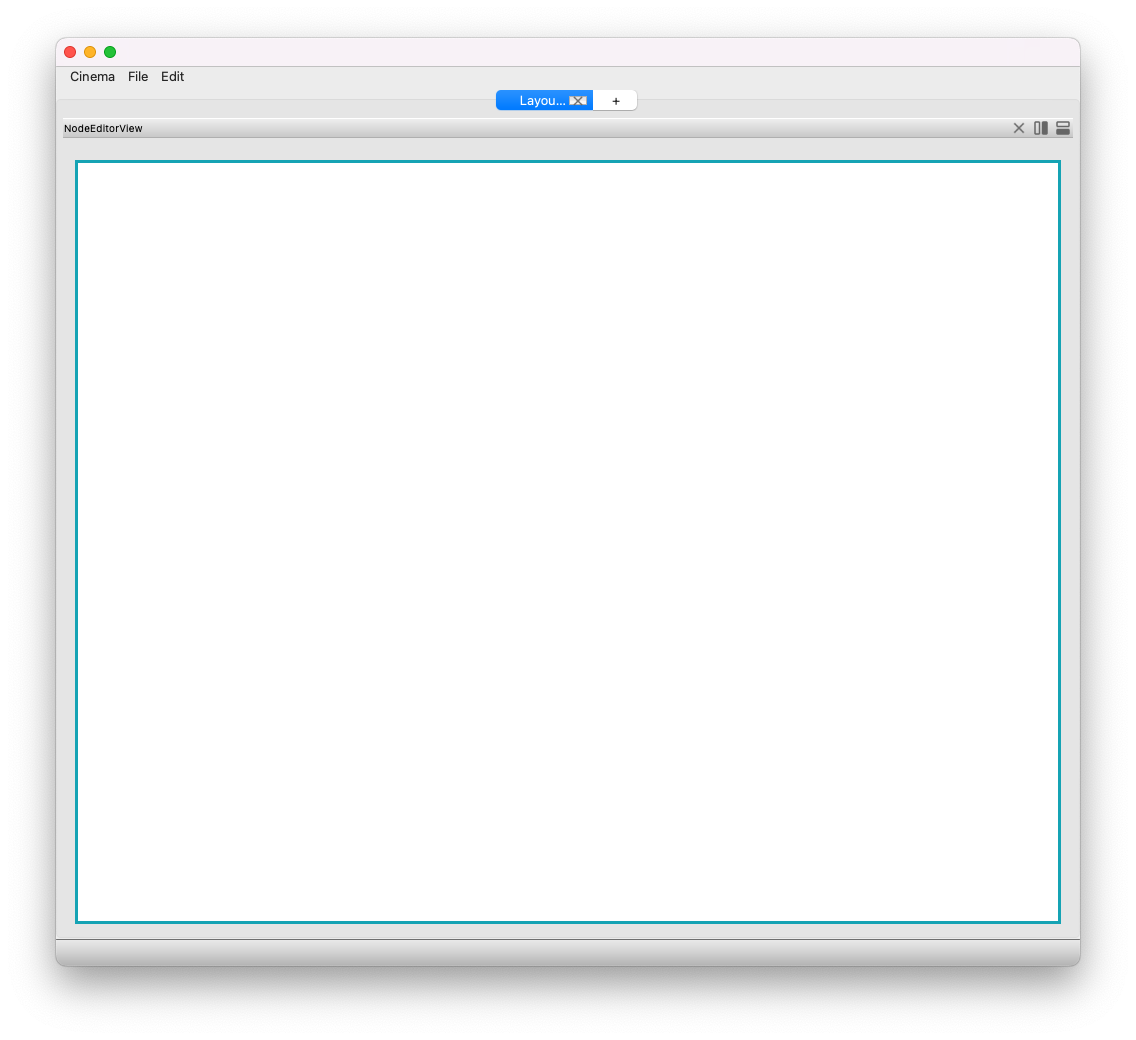
To get started, run the cinema application from the command line, and the Cinema:Theater application will open and you will see a blank window, which is the node layout window.
cinema
First, add a filter to read in some data. Click on the Edit menu item, and choose the Add filter … item. The filter selection window will appear. Double clicking on a name in the scroll box will create a node in the canvas.
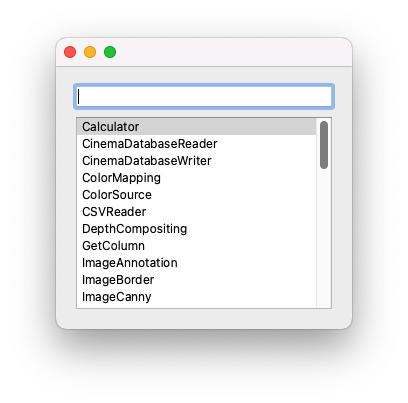
Once a node has been created, you will be able to edit attributes and make connections to other nodes on the node layout window (see below). See the section on node editing for more information about specific operations that can be done while editing nodes.
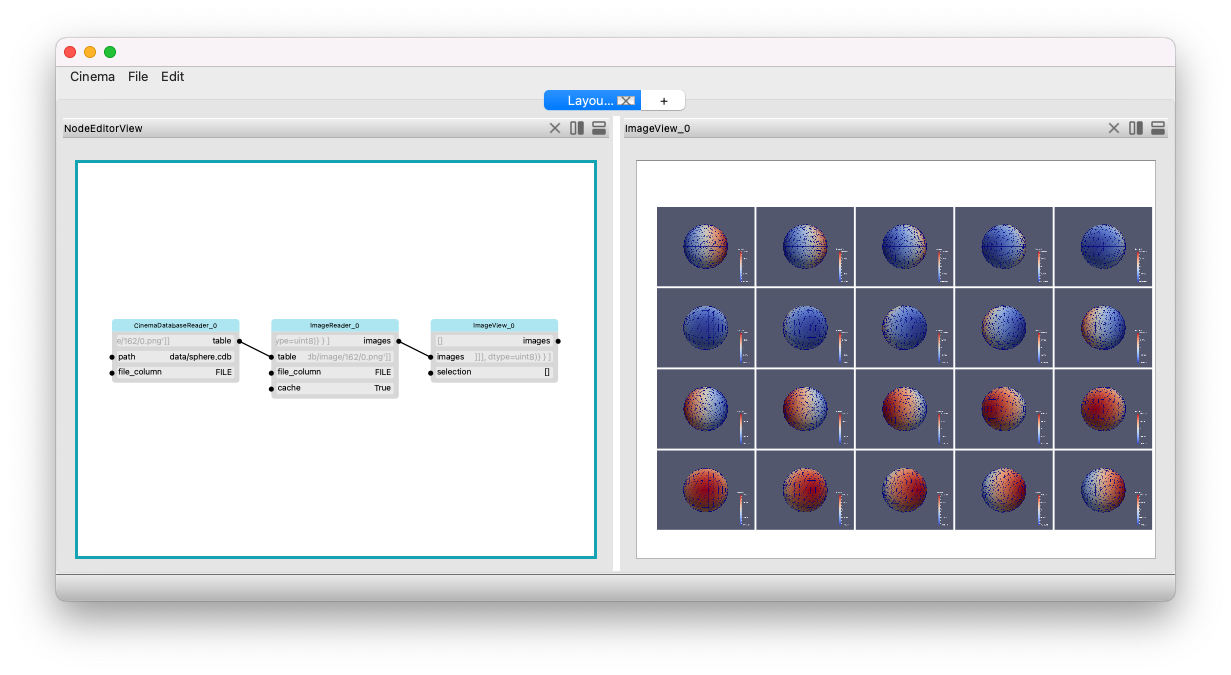
Creating a data view
To create a data view, click on one of the splitting operator buttons in the upper right hand corner of any window. This will split that window and present a panel of buttons that show the type of view that can be created. In this example, we choose the Image button, and this creates an image view that connects to the ImageReader, resulting in the application being configured as shown in the bottom image on this page. Note that creating a data view in this way also creates a node in the filter graph representing the view. This node is independent of the window (view) of that node, so it can be shown or not shown, but will still remain in the graph.